
Running a business is hard. Understanding how your business is performing compared to its competitors is even harder. Your website directly reflects your company’s health and can help you determine where you stand in your market. Analyzing your website traffic is the key to answering all these questions and is crucial for success in the digital world. With the right data, you can understand what users are up to monitor market changes. Its size up the competition and see how well your efforts convert. This comprehensive guide helps how to Check Website Traffic.
How to define website traffic

Website traffic is the number of visitors a website receives over a given period and is a crucial metric for assessing its popularity. There are a variety of ways that you can analyze website traffic; however, some of the most common metrics include monthly visitors, user engagement, marketing channel performance, and new vs. returning audience split – don’t worry we’ll dive deeper into each of these in a bit!
Top metrics to analyze website traffic
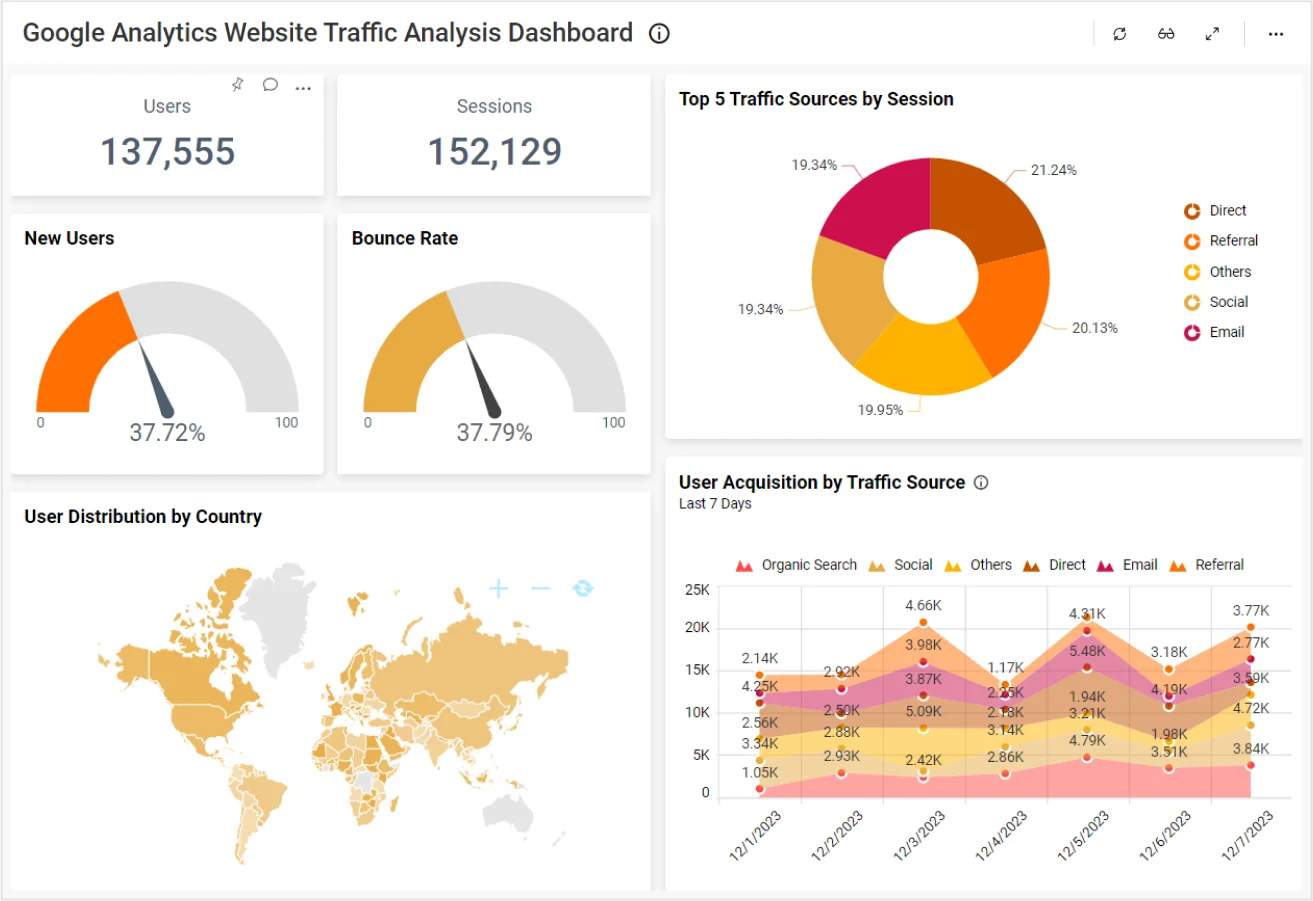
Various metrics are used when checking website traffic. It is depending on your goals, objectives, or even the team measuring the data. The ten below provide a general overview of your website performance.
Page Views:
This metric measures single-page views and calculates the average per visit or user session. Google counts each page load or reloads as a page view. Therefore, average page views show how many times a visitor opens pages on your site.
Pages Per Visit:
The average number of pages visitors view within a session. Unlike page views, it doesn’t matter if a visitor viewed the page once, five times, or twenty.
Bounce Rate:
Bounce rate is the percentage of visitors who leave your site without interacting with it. For example, reading through a blog, watching a video, or clicking a CTA). According to Google Analytics, bounce rate measures the percentage of single interaction visits to your site. The user “bounces” from the same page they entered.
Visit Duration:
A visit begins when visitors arrive at your website and ends when they exit or remain inactive for a predetermined period. As long as the visitor interacts with your site, the session continues.
Monthly Visits:
The average amount of traffic you receive each month. Average monthly visits are insightful when viewed in correlation with engagement metrics. For example, high monthly visits and low page views mean that you initially capture user attention but aren’t engaging them for long.
Conversion Rate:
The percentage of visitors to your website or landing page that complete a desired action. In most cases, this will be a sign-up or a purchase.
Daily Active Users (DAU):
The number of users who engage with your website daily. DAU reflects your growth potential and indicates the stickiness of your product or service.
Monthly Active Users (MAU):
The number of unique users or visitors interacting with your website monthly. It’s most useful for mobile apps, SaaS platforms, online gaming, social media, and any other online business that relies on returning customers.
Device Distribution:
Shows the percentage of visitors using mobile vs. desktop devices. Device distribution helps you identify trends in device usage for your app or web content.
Traffic Sources:
Measure where your traffic comes from, whether that be search engines, social media platforms, display networks, other websites, emails, and more.
Unique Visitors:
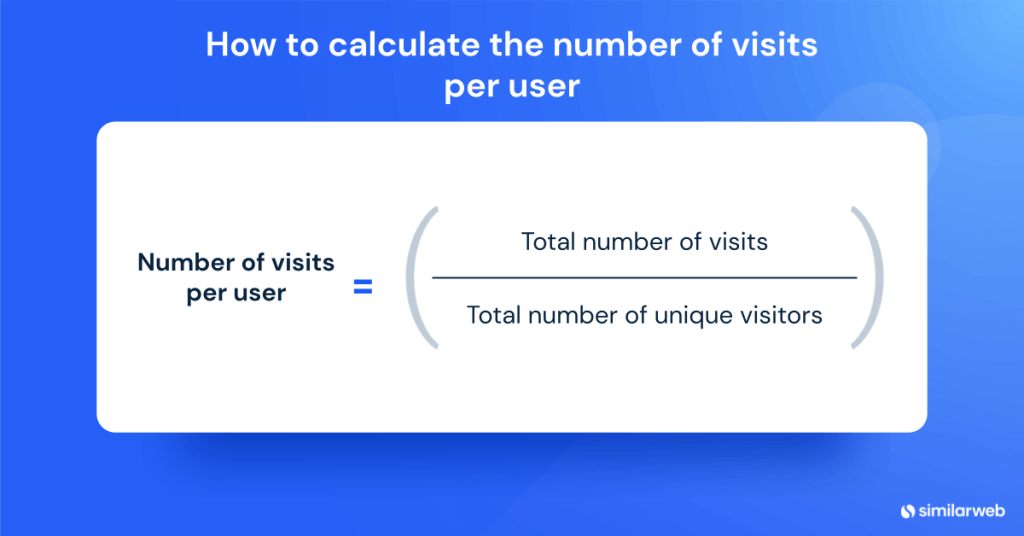
Unique visitors is a website metric that shows the total number of visitors to a site, counting only their first visit. If they return to the site later, these additional visits don’t count.
Learn how to calculate your average unique visitors
Your goal is to use a combination of these metrics to analyze and understand your website traffic, performance, and user behavior. Set KPIs that you’d like to meet quarterly or yearly and track any major fluctuations over time. This could be a sign to reevaluate your goals or adjust your digital strategy.
Analyzing traffic and engagement metrics:

Any KPI that reveals how visitors interact with your website, including session duration, pages per visit, bounce rate, or click-through rate (CTR), falls under user engagement metrics. These metrics help you measure your engagement rate or how much your audience is actively engaged with content on your site. Monitoring your engagement rate helps you determine customer satisfaction, identify potential churns, analyze the efficacy of a campaign, and spot areas for improvement.
Monthly visits:
![How Many Visitors Should Your Website Get? [Data from 400+ Web Traffic Analysts]](https://www.hubspot.com/hs-fs/hubfs/how-many-visitors-should-your-site-get_6.webp?width=650&height=402&name=how-many-visitors-should-your-site-get_6.webp)
On average, how much traffic does your website receive each month? This metric is the foundation of your website traffic analysis and can help you answer general questions about your performance vs. your competitors and the industry. Keep in mind that regular traffic fluctuations are normal and are to be expected during certain periods, such as the holiday season. You can anticipate and prepare accordingly if your monthly visits follow the same pattern each year.
Engagement metrics
Visit duration, page views, and average pages per visit all give you an idea of how a user interacts with your website. These metrics answer how long the average user spends browsing, which pages they’re most likely to visit, and how many. The average visit duration to sephora.com in 2023 was 4 minutes and 22 seconds, significantly higher than the Beauty industry benchmark. Most visitors to Sephora view 4.9 pages, which is higher than the industry average and peaks at 5.5 pages per visit in November, around the holidays.
Unique visitors

Unique visitors are not duplicated across devices — visitors within the specified period are counted only once. There was an average of 18.3M unique visitors to sephora.com in the US in 2023 – mostly from mobile web, highlighting the importance of a functional and easy-to-use mobile design.
Bounce rate
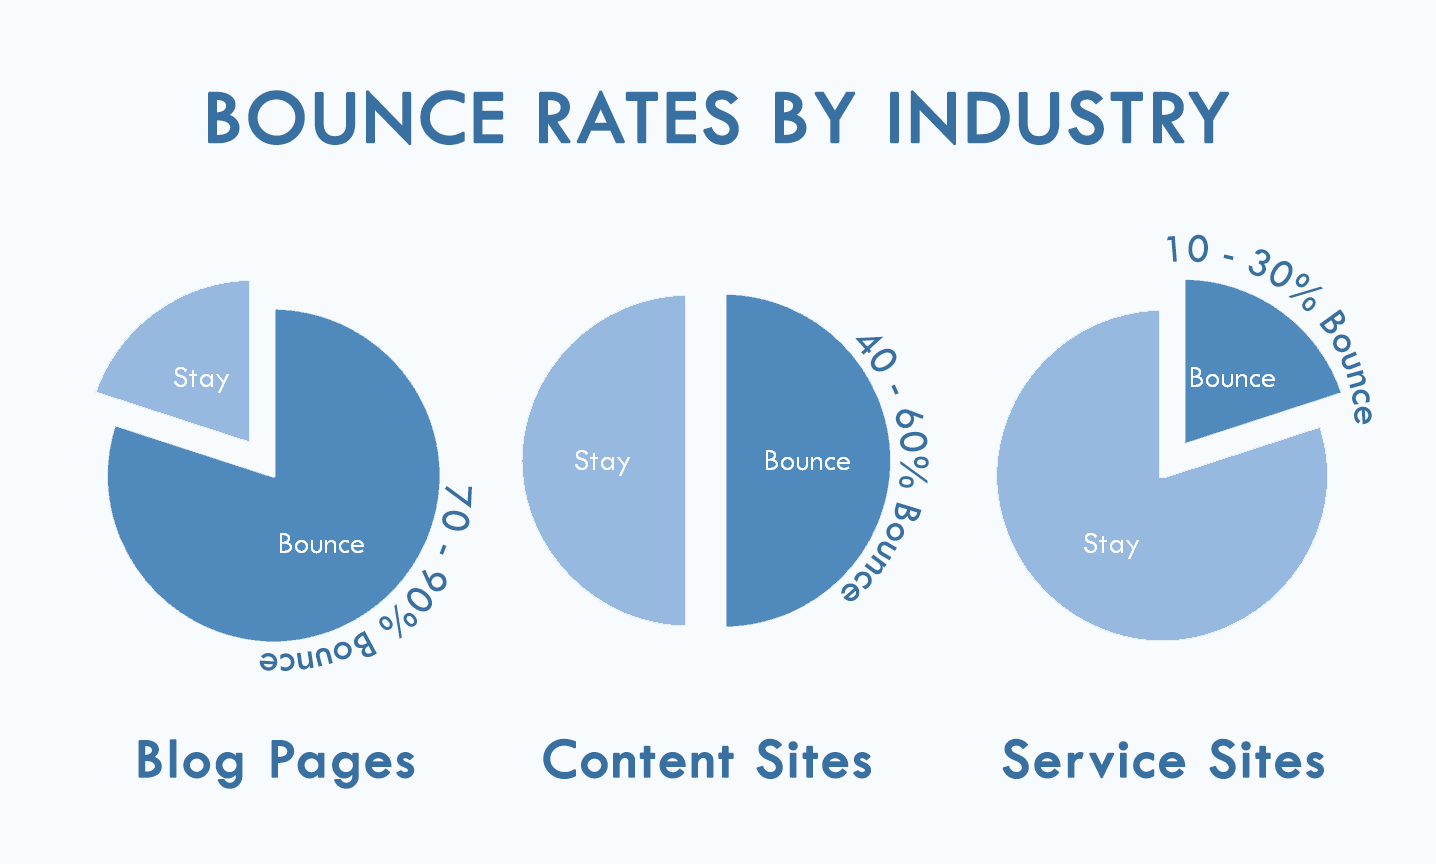
Bounce rate counts all visitors who leave your website from the same page they entered without taking action. A high bounce rate indicates false visitor expectations, a technical error, or a leaking funnel. Sephora has a 45% bounce rate, which may seem high but is lower than the Beauty & Cosmetic industry average. We see that the lowest bounce rates correlate with periods of high traffic volume, like in November and December.
New vs. returning users
Analyzing the ratio of new vs. returning users showcases the split between acquiring traffic and/or retaining current customers. So, it can gauge the “stickiness” of your website. A sticky website means customers come back rather than seeking alternatives.
Device split
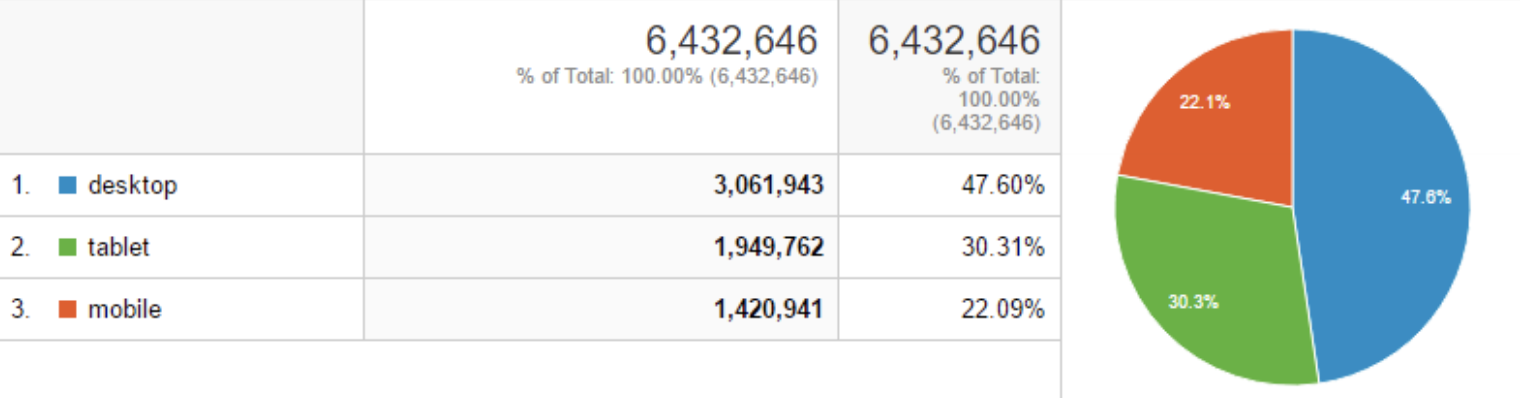
Examining device distribution gives insight into how your audiences access your website. This metric is crucial for optimization, as user experience between desktop and mobile web varies greatly. Like most industries today, sephora.com is experiencing a significant shift to mobile usage. Users are nearly three times more likely to access the website from their phones than from desktops.
Analyze your website’s audience:
Audience analysis tools help you define your users’ demographic and behavioral characteristics, including age, gender, location, interests, and more. It’s an important part of checking website traffic; as you gather information about where your audience spends time online, you can better engage them and explore new growth opportunities.
Audience demographics

Audience demographics pinpoint exactly who your customers are – and knowing their challenges is crucial when developing marketing, advertising, and sales strategies. So, the demographics tab of Website Analysis gives a general overview of the gender and age distribution of any website in any given country.
Audience interests

Once you know your audience, an important step in analyzing website traffic is understanding their browsing habits, including industries, topics, and other domains they are interested in. So, most visitors to similarweb.com visit other computer electronics and technology websites, as well as online marketing, programming, web design, and multimedia domains, such as LinkedIn, ChatGPT, Canva, Google Translate, and Google Meet.
Checking traffic across marketing channels
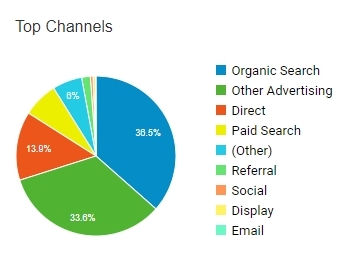
Identifying the marketing channels that bring the most traffic to your website is crucial so that you can concentrate your marketing budget and uncover opportunities to win even more traffic.
- Direct: Traffic from users directly entering the URL, using a bookmark or saved link, etc.
- Email: Traffic sent from web-based email clients such as gmail.com.
- Referrals: Referral traffic includes traffic to a site through affiliates, links, content partners, and traffic from direct media buying or news coverage.
- Social: Traffic sent from social media sites, such as Facebook or Reddit.
- Organic Search: Refers to the search results of a search engine that cannot be influenced by paid advertising.
- Paid Search: Search results that generate a large amount of traffic from advertising budgets that usually focus on increasing brand awareness or targeting relevant audiences for specific products.
- Display Ads: Traffic from other domains via a known ad-serving platform (i.e., Double-click, Taboola).
- Related post: How to Create a Wix Website in 10 Easy Steps
- Related post: 10 Best Front End Web Development Tools in 2025
- Related post: 10 Elements Every Website Should Have